Monday, April 22, 2024

"Charm City" - SafeGrowth in Baltimore

Baltimore skyline and harbor - photo by Patrick Gillespie, own work, CC BY-SA 4.0

by Mateja Mihinjac

Only two weeks after a tragic Baltimore bridge accident, we returned to Charm City for the second part of the SafeGrowth training workshop. 

Like in most of our training workshops, students formed teams to work on problems in their own neighborhoods and this week they ended their 2-month training with some outstanding presentations to the public. The presentation day celebrated their successes, dedication, and commitment to bettering their neighbourhood. 


THE FIVE TEAMS

In this SafeGrowth training workshop, we partnered with the Greater Baybrook Alliance (GBA), a truly excellent non-profit community development corporation responsible for improving liveability in three Baltimore neighbourhoods: Brooklyn, Curtis Bay, and Brooklyn Park. 

Thirty participants were divided into five teams. They followed the 5-step SafeGrowth process where they identified and analysed their chosen problems, diagnosed harms, crimes, and the underlying causes, and then formulated solutions. 

Just like in the Charm City documentary trailer, the teams identified violence and drug-related issues that have a devastating impact. Most importantly, they understood that they, as community members, play a crucial role in tackling issues together with the police, organizations like schools and businesses, and other partners. 


One of the training venues in Baltimore county


Team 1: Hanover Street (commercial street)

This team identified overlapping issues affecting safety and the feelings of safety. Those issues in turn led to major economic impacts and traffic problems in this culturally diverse commercial street: loitering, drug selling, littering, underlit areas, and several vacant properties. The team discovered how the vacant properties and lack of ownership contributed to street problems, including crime. This was easily observed by anyone walking along that street, especially after dark. They are in the process of formulating some practical responses.


One of the classroom design exercises 


Team 2: Brooklyn Homes Basketball Court

This team referred to their project area as “the forgotten place” due to the lack of desirable activity and increased fear of the area ever since a mass shooting at this location in July 2023. In their first training workshop two months ago, the team learned about the thesis of Jane Jacobs who described the crime risks in empty and vacated areas with no “eyes on the street”. This fits the situation at the basketball court. 

The team first examined how youth congregated and what they did, and then examined problems with vehicle thefts, robberies, and aggravated assaults. This basketball court will undergo a redevelopment shortly and the team will ensure that they work closely with the partners and stakeholders in charge of the rebuild. Their goal is to ensure the basketball court becomes an activated space that fosters community engagement and social cohesion and thus regains its prominence in the neighbourhood as a positive gathering space.


Participants partnered with city and county police on problem-solving
during project work

Team 3: Team Landlord

Team Landlord choose to investigate a major problem of illegal renting and slumlord activity on neglected and vacant properties. This is a Baltimore-wide problem and it is often seen as a contributor to illicit drug activity and violence. The team confirmed this hypothesis and – because their analysis allowed them to associate problem properties directly to issues like drug use and drug dealing, prostitution, trafficking, loitering, and squatting – they were able to identify specific vacant properties as a major threat to safety and livability. 

The team was excited to confer with some local legal experts regarding legal and regulatory strategies to mitigate the problem. They now have intentions to formulate a systematic solution that can influence the slumlord issue throughout the entire city. 


The Greater Baybrook Alliance community organization was an outstanding facilitator of the SafeGrowth work in the three neighborhoods

Team 4: Riverside Road Park - Brooklyn Park Champions

The Champions chose to tackle an empty lot on the city/county line that has also been forgotten and neglected. Consequently, as discovered by Team 2 on a different project, Jane Jacob's "eyes on the street" theory was also a factor in this property - it now attracted undesirable activity. In addition to speeding and trash dumping, the team uncovered petty crime, drug-related incidents, vandalism, assaults, and thefts from autos. 

The team also pointedly recognised that all these issues visible on the surface are symptoms of underlying problems with poor social cohesion in the neighbourhood and lack of care or activation in the park. Their detailed analysis led to some initial strategies which, during their public presentations, allowed them to receive public feedback and narrow their responses even further. 


Spanish speakers tackled school-related violence with considerable
commitment to safety - they had children attending the schools

Team 5: Ben Franklin High School

This Spanish-speaking team of vibrant residents chose to address the issue of school kids’ fights spilling over from Ben Franklin High School onto an adjacent alleyway. The fighting outside the school was worrying, but they were also concerned that the fights might worsen without some coordinated intervention. A few of the team members were mothers of young children, some attending the school, and they were concerned about the well-being and the future of their children. 

The team conducted site visits to the property and received input from others in the area. Their crime analysis is still underway. This preliminary research reaffirmed their need for further study into the underlying issues for more comprehensive strategies. They have their homework to do! Foremost in their next steps was to develop partnerships with key stakeholders such as school officials and a nearby church adjacent to the alleyway. Equipped with more detailed research and data, this will be their next step. 


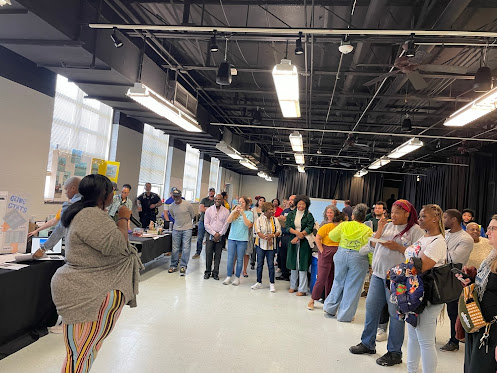
Presentations during the poster sessions with about 70 members of the public. The community response was excellent


GBA executive director, Meredith Chaiken, addresses the audience. GBA staff were outstanding, particularly director of public safety, Daisy Heartberg, & neighborhood safety coordinator, Yvette Bailey-Emberson


INITIAL STEPS TO MOVE FORWARD 

The teams have now made the initial steps towards solutions for their different problems through comprehensive SafeGrowth projects. But there is much yet to do. They will continue to build their projects in the coming months and then create partnerships along the way. As they finalize their partnerships and project schedule, they will then start implementing strategies. 

The Greater Baybrook Alliance is examining a more permanent problem-solving process to address neighbourhood problems with their partners, such as businesses and police, and formulate a long-term plan for safety. 

We are proud of the hard work of these teams of committed residents, business people, police, and others in the class. In a very short time, they accomplished an incredible amount of work as they applied the SafeGrowth philosophy, CPTED, planning concepts, crime analysis techniques, and project management. Their work is the mark of high-quality community leaders. The Greater Baybrook Alliance has launched an incredible community capacity-building process. This part of the “Charming City”, it seems, has a bright future! 


Sunday, March 31, 2024

Liveability - the key to success in community development

Liveability is not only physical infrastructure - Photo courtesy of Denys Nevozhai - Unsplash

by Mateja Mihinjac

What is liveability? Liveability is one of those buzzwords that has been used extensively in urban development and city planning circles. Yet, it is one of those words that mean different things to different people and organisations and they rarely offer a consensus on what it means.

For example, the Online Cambridge Dictionary defines liveability as “the degree to which a place is suitable or good for living in”.

The organization, Partners for Livable Communities, takes a more specific approach: “Livability is the sum of the factors that add up to a community’s quality of life—including the built and natural environments, economic prosperity, social stability and equity, educational opportunity, and cultural, entertainment and recreation possibilities.”

Different definitions of liveability raise some important questions. Is liveability simply a binary concept? What parameters should it consider?


IS IT JUST BINARY?

Over the years, and especially since Greg Saville and I wrote our first article on Third Generation CPTED in 2019, I’ve had interesting discussions in professional circles about liveability.


At some point, liveability must mean the perspectives of people


First, I am asked about levels of liveability. In our article, Greg and I proposed neighbourhood liveability exists on a spectrum from advanced level to moderate and basic level neighbourhoods. An advanced-level neighbourhood will be highly liveable and offer opportunities for addressing the lowest and the highest level personal and social needs. Conversely, the neighbourhood at the basic level will generally have a bare minimum infrastructure and services for addressing the basic level physiological and psychological needs.

Sometimes, I am asked whether liveability exists or it doesn’t exist – a binary relationship. That would mean we should classify neighbourhoods as either liveable or non-liveable. 

In our view, liveability should be assessed on a spectrum similar to that of personal health. There are many levels of health with a multitude of contributing factors; we don’t simply say one is healthy while another is unhealthy. Similarly, as we describe in our 3rd Generation article, liveability of a neighbourhood has many facets that may contribute to higher levels of liveability in some categories and lower in others.

Existing liveability indices support our view. The continuum of liveability shows up when world cities are ranked based on their liveability scores in relation to economic, health, physical, and social factors. Organisations using these indices affirm there is a continuum of liveability. 

For example, 

  • The Economist’s Intelligence Unit assigns different weighing to categories of stability, healthcare, culture & environment, education, and infrastructure to calculate the total index. 
  • Mercer’s Quality of Living City Ranking uses categories of political stability, healthcare, education, infrastructure, and socio-cultural environment. 

These are just some examples of why it appears unproductive to refer to liveability as a binary concept.


Integrating green with concrete infrastructures can improve livability - Photo courtesy of Unsplash

WHOSE LIVEABILITY PARAMETERS?

Another point of contention is the categories employed when evaluating liveability. The Centre for Liveable Cities points to the tangible elements associated with physical infrastructure and availability of services like housing affordability, road access, school, and shopping access.

Undoubtedly, such services are paramount for a good quality of life. Unsurprisingly, cities like Singapore and Vienna score highly on the liveability scale largely due to these types of elements. 

But a question remains: Should we rely on those categories defined by the organisations conducting liveability surveys? Or should we delve deeper and identify what liveability means to people living in a particular neighbourhood? 

Our choice is the second option – liveability should be based on residents’ assessment of whether their needs and desires are being addressed where they live. This might make comparisons between neighborhoods difficult and it will surely annoy evaluators. However, the methodological needs of the evaluators seem secondary to the needs of the residents. It seems more realistic to ask those who actually live in a place to define their own perceptions of where they live. 


Liveable cities offer social places - Photo courtesy of Toni Ferreira, Unsplash

IT'S PEOPLE! 

One thing is certain: liveability should put people and local communities at the centre. This view is supported by many different sources. For example, consider the website of Partners for Livable Communities. They too identify people as the greatest resource for community change.

It is also identified by the senior communications adviser for the Congress of New Urbanism, Robert Steuteville, who asserts the importance of walkable and integrated living environments for building social capital and promoting a sense of belonging within a community.

Another supporter emerged in a recent interview with urbanist Richard Florida. His view was that the key element of liveability centers around community building, housing affordability, and access to health & wellness.


TO-FOR-WITH

From our perspective, liveability starts with people. The core philosophy of SafeGrowth is the TO-FOR-WITH principle – we aim to work as much “with” residents in a place rather than delivering programs “to” them or “for” them. It has historical roots in sociology and community development going back to the action research studies of the last century. It was the method employed in our successful SafeGrowth work in New Orleans.

Instead of relying on professional agencies to identify liveability categories, or discussing whether some city or neighbourhood is liveable or not, we need to start paying more attention to people. We must find out what liveability means to them and what they need to improve it. 


Monday, March 25, 2024

Nihilism nixed - hope as a way forward

In crime prevention and community-building, perspective is everything! 

by Gregory Saville

I am struck by the optimism in the cases described in recent blogs – Beth’s story about the Portland TriMet community safety team; my blog on answers to homelessness, especially the miracle underway today in Finland; the numerous examples of successful solidarity in Mateja’s blog about how we have witnessed communities come together to rebuild after natural disasters.

And yet I am also struck by the political blindness people choose to accept when it comes to difficult situations, like high crime neighborhoods, and how hopeless things seem. I was told, before our recent training in Baltimore, that there are unsurmountable obstacles in that city with drugs, shootings, fiscal chaos, and hopelessness (said by people not from Baltimore). 

Yet, on the ground during training, residents and community-builders who live there had a different view. Yes, there were problems, but they dedicated themselves to doing something positive. Currently, they are doing just that. (We return to Baltimore next month to review the results).

It is easy to be distracted by news stories of wickedness around the world

GLOBAL TRENDS

In the middle of news stories about the doom and gloom around us, and the very real terror of nuclear war and environmental collapse, I often remind myself how easy it is to fall into a nihilistic, hell-in-a-handbasket funk. 

Then I read Ronald Bailey and Marian Tupey’s book Ten Global Trends Every Smart Person Should Know and dozens of charts, graphs, and data showing inexorable positive directions for dozens of social, economic, and crime trends around the world. Life expectancy, poverty, health, food resources… all getting better, not worse! How can this be so? So many people believe the doom and gloom story! 

Maybe, I thought, these authors got it wrong. Did they get caught in a confirmation bias trap and cherry-picked rosy data and ignored the rest. To answer that, I went on a deep dive into data on global trends to see if they were right. 

Here is what I found:

Life expectancy… going up. Even a downward blip during the global pandemic does not offset the enormous improvements over the decades.


Global access to technology like electricity, even in the poorest countries, has markedly improved.


Child mortality around the world has been plummeting for decades. Bailey and Tupey were right.


For over 500 years, global literacy rates have grown every century and continue to improve today.

And there it was, from one source after another, chart after chart, the list of positive trends goes on and on. 

NIHILISM NIXED

But you'd never know it! You’d never know so many trends are improving if you only watched the miracle of stupidity that is the 24-hour news cycle spitting out, as it does, tragedy after tragedy! With billions around the world, and cell phones in every nook, it is not difficult for news machines to find one “exclusive” horror after another. It may not be the full truth – and it is certainly not investigative journalism – but it sells!

In SafeGrowth, we teach neighborhood dwellers how to do basic field research, how to collect a wide variety of stats, and how to observe carefully. That is how they can get a complete picture before they devise a plan to make things better. You cannot fix something if you drink the noxious elixir of political ideology or popular nihilism. The truth emerges as we dig for ourselves, suspend our biases, and, as Jane Jacobs once described, cultivate the art of seeing clearly

Seeing clearly, beyond the opinions and biases,
means learning how to do research and conduct careful observations

I met a student during the Baltimore training with a family member who, once upon a time, was a famous drug dealer back in the day. Now out of prison, this person turned away from gangs and violence and is now committed to speaking publicly about other ways forward for wayward teens. It is an inspiring story.

There are many challenges facing us both globally and locally. We cannot fix them with doom-and-gloom shades or with rosy glasses. We must retain optimism and hope, but only with clear eyesight. Threats are real, but so too are solutions. Inspiration, as I found out in Baltimore, can come from unlikely places if you learn to see and listen clearly.


Saturday, March 9, 2024

Riding that train with TriMet's Safety Response Team - Part 3


Portland's TriMet mass transit serves over 50 million riders annually in metro Portland. The SRT Team works on this system. Photo Steve Morgan - CC BY-SA 3.0

Beth Dufek is a writer and marketing strategist for clients who are improving the built environment. She runs her own consulting firm in the Pacific Northwest. As a member of the SafeGrowth Network, she teaches SafeGrowth in cities across the U.S. This is Beth’s third blog on responding to people in crisis on the street.


To round out the third of my SafeGrowth blog series, (see also January, 2024  and November, 2023) I am pleased to share a morning spent with one of the many Portland TriMet Safety Response Teams in my final blog on this topic. 


HERE’S HOW WE ROLL

I arrived at TriMet’s Public Safety Office at a reasonable 10am on a partly cloudy, crisp, dry day in February. Having no idea what it’s like to be outside all day anymore, I layered up, packed snacks, and changed my shoes three times. 

I was warmly greeted by a four-person Safety Response Team (SRT) who started their shift at sunrise: 7am. Each person had a unique reason for joining the SRT, ranging from social work and trying a new career to former issues with addiction. Comradery among the team seemed essential. They maintained a sense of humor (they were hilarious), shared stories (especially about food), and watched out for each (something they took seriously). 

Here is how I saw TriMet’s four core principles of the SRT play out in 2 short hours.


SRT on the system. Photo courtesy of Tri-Met


HIGH VISIBILITY SYSTEM PRESENCE 

SRTs work in two shifts, 6 days/week. Each SRT has one team lead and three team members. Each shift has three to five teams on the system. They cover TriMet’s 533 square mile service area within the regional counties of Multnomah, Washington and Clackamas.

The team I rode with estimated they interact with 30 - 50 people per shift, but it depends on the day. Interactions are not limited to people in distress or mitigating behavioral issues. They may help people navigate the system – that they know like the back of their hand – or help tourists get to their destination. They enter each interaction into a Smartsheet app on their phones, which TriMet aggregates to track trends. In November 2023, the SRT interacted with 11,354 people, 8,022 of whom were offered services. 


Rose City Resource list made available by SRT

CONNECTING RIDERS TO RESOURCES

Within minutes of leaving the Public Safety Building, we stopped so the team could ask a person if he got to a place that could help him. In an earlier interaction that day with him, he needed a place that would cash a check without an ID, to get the paperwork to get the ID, and then get to a less temporary place to stay. He was ecstatic that he found a place to stay for a month. To think, I was worried about what shoes to wear.

The SRT carries printed copies of Rose City Resource from the organization Street Roots so they can point people to community-based resources on the spot and tell them which bus or train to take to get there. I am so impressed by their system navigation - I have nearly zero geographical memory; therefore, by the grace of Google Maps go I. 


The SRT backpack and contents for use on the Tri-Met system - Photo courtesy of TriMet


At each stop, the SRT approaches people in pairs for safety to do wellness checks. Granola bars, water, and maps, among other supplies are on offer. They have an affectionate reputation for being “the people with the backpacks with granola bars.” One man at first declined any supplies, but after some kind SRT persistence, he asked for socks (and got them)! 


LOW-LEVEL ISSUES PREVIOUSLY DIRECTED TO 911

At the Pioneer Square transit center, Portland’s “living room” and once THE place to be for entertainment and culture, a person curled up under a moving blanket was asked “Are you ok? You don’t have to interact with me, but can you just let me know you are ok? I have resources for you, but only if you want them.” 


Pioneer Square in Portland. A N/W view showing the west side of the square on a sunny day. Photo courtesy of Steve Morgan, CC Wikipedia


I learned that Pioneer Square is a privately owned public space, and given the current conditions downtown - alcohol and/or drug use, camping, urination, defecation, or indecent exposure, not to mention more overt crimes - they have their own security due to the volume of issues. I was saddened to see the private security simply shoo the person the SRT offered resources to away … from the living room. 

I observed that people were unsure how to interact with the quite official-looking team. They assured me they were used to it. I expressed my concern that people think the SRT initiated the security guards’ action. They said it happens all the time, so they stay in their resource-offering lane and feel good about the help they provide. 


SOME HUMANS HELPED, INCLUDING ME

I started this series by questioning how humans can help other humans. Spending time with SRT members in the classroom and on the train has helped this human believe in Portland’s resilience. One SRT member told me they had more conservative ideas about how to deal with the homelessness crisis before joining the SRT, but after helping people on TriMet’s system in dire circumstances due to drug addiction or mental illness, they have more empathy and want to be a part of the solution. 

It can be tempting to draw conclusions and reinforce biases about the fentanyl crisis, homelessness, and social unrest in order to join a conversation fueled by sensationalized local news and social media. These issues demand serious attention, but I want to end with a thought-provoking post by Alice McFlurry at Beige.Party

Let’s normalize saying, “I don’t know enough about the topic to be able to comment.” 

For me, it is a reminder to take the time to ask the questions before forming the hypothesis.


Monday, February 26, 2024

CPTED Conference in Palm Springs - Practical solutions vs public safety theater

The CPTED Conference in Palm Springs is sponsored by 
CPTED/PCAM Canada and CPTED USA, May 7-8, 2024

by Gregory Saville

Some time ago we posted various blogs on the pros and cons of security technology as a solution to crime. Some technologies, we concluded from the evidence, provide an excellent addition to a safe environment as long as they are well-understood by the community and targeted strategically. The K-5 security robot patrolling late-night underground parking might be one example.

But other technologies promise more than they provide. Over a year ago, Mateja wrote a blog on the acoustic gun detection system “Shotspotter” as one example of a technology that had mixed results. Mateja’s blog on the topic wrote that studies “conclude that [acoustic security technology] AGDT may actually be ineffective and inaccurate and can thus waste police resources” 

Now the popular media (and more importantly, city decision-makers) have finally taken up our argument and tell an alarming story. The CNN news stream just reported that critics are sounding the alarm that the ShotSpotter gunfire detection system is ineffective


PUBLIC SAFETY THEATER? 

Despite over a hundred cities employing the technology (one wonders whether those cities used any form of criminological due diligence before their purchase?), it turns out cities like Chicago, Atlanta, and Portland have rejected this security technology. These are cities that direly need some respite from street crime. The article asks whether such technologies are ‘public safety theatre’

The reality is that in places like Houston, that use the technology, out of over 4,000 ShotSpotter alerts, only about 200 turned into arrests. Then again, 200 arrests following a gunfire detection alert isn't unimportant. Is the price tag worth that amount?  That’s a good question and a simple answer might be – yes! Yet, if shots occur in a neighborhood with decent design and friendly community relationships, maybe residents will call the police on their own and report the details. That might just as easily result in an arrest. 


USA/CANADA JOINT CONFERENCE

The webcast on community-building through 2nd Generation CPTED


I recently joined some other CPTED experts in describing an alternative to the tech security solution. We discussed a human-centered approach to safety and security called 2nd Generation CPTED. During the webcast, we showed examples where residents and other community members had a direct, and powerful, role in improving their own safety. We showed examples from schools in Oregon, skate parks in Saskatoon, Texas, and British Columbia, and city planning tactics in Florida and New Orleans. 

This CPTED USA/CPTED-PCAM Canada webcast precedes the 2024 joint conference in Palm Springs, California. To see the latest in technology, how to marry sensible technology with community empowerment, and case studies of advanced examples of crime prevention, register for the May 7-8 conference here.

See you there.

Wednesday, January 31, 2024

Is This The World We Created? Part 2


From 30,000 feet, the city hides many blemishes. On the ground, not so much.

by Gregory Saville

In my last blog Is This The World We Created? I discussed the growing problem of street homelessness in cities around the world. I presented facts and listed some responses. Most of those responses use a continuum of care in which people who are homeless must climb a staircase of supports with housing at the top as the final step.

Perhaps that is wrong? Maybe it should be the other way around in which care follows housing as in the Housing First program?


CRIME = HOMELESSNESS?

While there is not necessarily a connection between homelessness and crime, the public makes the crime/homelessness connection. Take for example recent media comments by a British Columbia citizen group Save Our Streets:

“Drug addictions and drug trade, mental health challenges, law enforcement, judicial reform, homelessness, are all factors…while governments have a long history of announcing policies and programs meant to respond to these issues, the desired results have not been realized.”

So in the mind of the public it seems one issue relates to another. Further, there is growing discontent that current government programs are ineffective at solving the problem, a view supported by some of the research I discussed in the last blog. What can be done?


FINLAND


In Canada and the U.S., we have homeless rates of .8 and 1.7 per thousand people respectively. It’s much worse in other European countries. 

What would it be like if we could reduce that to 0.1 of the total population? In other words, in the U.S. over 600,000 people live without shelter or food each night. If we cut that to 0.1 we could virtually eliminate most of the homelessness in our cities. 

Why 0.1? Because it has already been done in Finland.

The video above explains how the country of Finland used a modified and expanded version of the Homes First program to accomplish precisely this result. Finland’s success is not based on a staircase, but rather by starting with housing and then adding intensive and sustained supports later.


WALLS MUST FALL

Of course, this is not a simple proposition and there are many walls in the way. 

First, the Finnish response is not simply to house people but rather to provide intensive, and sustained, services immediately upon housing people. When the city of Medicine Hat, Canada tried the Housing First method they had initial success. Sadly, they did not follow up with the intensive and sustained servicing that was available in Finland. Thus, five months after housing people, the problems and homeless rates returned.

Then there is the city of Wheat Ridge, Colorado. They shut down homes for the homeless in motels due to ongoing crime concerns, thereby forcing those residents back onto the street.


Clearly, the Finns understood the importance of intensive and sustained in-home support (in-house security, substance abuse counselling, mental health services, financial support, etc). They understood what would happen without that support.


HOW MUCH WILL IT COST?

Finally, there is the issue of cost. This is not a trivial obstacle. However, as Charles Marohn reveals in his book Strong Towns, there is already tremendous wasteful municipal spending on zero rate-of-return municipal projects. 

I made this point 15 years ago in my blog Give me a $1,184 inch…and I’ll make me a mile. In that blog, I unpacked a $2.67 billion highway connector project in Houston that cost $75 million per mile, or $1,184 per inch (in a city that already had between 14,000 to 30,000 homeless people). 

Just imagine... giving up a single mile of that roadway connector could create over $75 million for homes. And since former SafeGrowth blogger Tod Schneider tells us they have developed Conestoga Huts for homeless people that cost $1,500 each, that means a single mile of Houston’s connector could free up over 50,000 homes, far more than enough to house every single homeless person in Houston. 

This back-of-envelope (and admittedly simple) calculation ignores many other more sophisticated ways to make enhanced Housing First a reality. It also ignores other walls, like figuring out where to locate those small homes without triggering the ire of the Not-In-My-Backyard crowd (a crowd that, incidentally, is already being encroached on by uncontrolled tent cities and unsanitary encampments).

And while we are making those calculations, let’s remember how living without a home or food can turn into a horror show, as this blog has documented in the past when some Denver residents without homes were attacked by flash-bomb grenades


Photos of injuries sustained by Molly during a flash-bang grenade attack - a crime still unsolved

Surely we can create a better world for those most in need.